Honda HR-V: Current Waveform Samples
NOTE: This is GENERAL information. This article is not intended to be specific to any unique situation or individual vehicle configuration. For model-specific information see appropriate articles where available.
EXAMPLE #1 - VOLTAGE CONTROLLED DRIVER
The waveform pattern shown in Fig. 4 indicate a normal current waveform from a Ford 3.0L V6 VIN [U] engine. This voltage controlled type circuit pulses the injectors in groups of three injectors. Injectors No. 1, 3, and 5 are pulsed together and cylinders 2, 4, and 6 are pulsed together. The specification for an acceptable bank resistance is 4.4 ohms. Using Ohm's Law and assuming a hot run voltage of 14 volts, we determine that the bank would draw a current of 3.2 amps.
However this is not the case because as the injector windings become saturated, counter voltage is created which impedes the current flow. This, coupled with the inherent resistance of the driver's transistor, impedes the current flow even more. So, what is a known good value for a dynamic current draw on a voltage controlled bank of injectors? The waveform pattern shown below indicates a good parallel injector current flow of 2 amps. See Fig. 4.
Note that if just one injector has a resistance problem and partially shorts, the entire parallel bank that it belongs to will draw more current. This can damage the injector driver.
The waveform pattern in Fig. 5 indicates this type of problem with too much current flow. This is on other bank of injectors of the same vehicle; the even side. Notice the Lab Scope is set on a one amp per division scale.
As you can see, the current is at an unacceptable 2.5 amps.
It is easy to find out which individual injector is at fault. All you need to do is inductively clamp onto each individual injector and compare them. To obtain a known-good value to compare against, we used the good bank to capture the waveform in Fig. 6. Notice that it limits current flow to 750 milliamps.
The waveform shown in Fig. 7 illustrates the problem injector we found. This waveform indicates an unacceptable current draw of just over one amp as compared to the 750 milliamp draw of the known-good injector. A subsequent check with a DVOM found 8.2 ohms, which is under the 12 ohm specification.
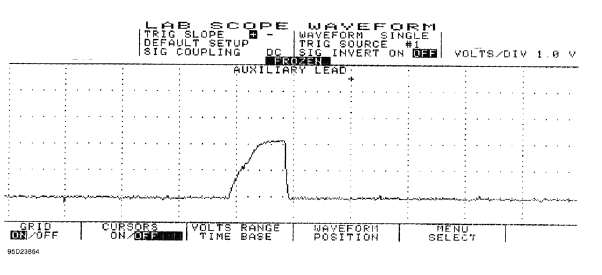
Fig. 4: Injector Bank w/Normal Current Flow - Current Pattern
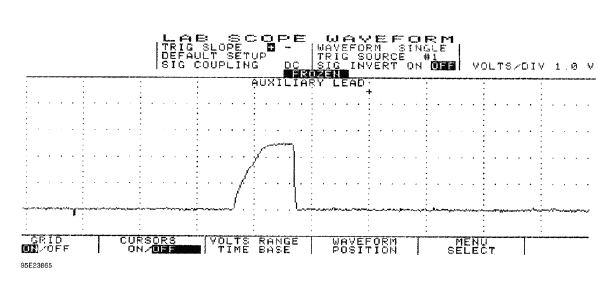
Fig. 5: Injector Bank w/Excessive Current Flow - Current Pattern
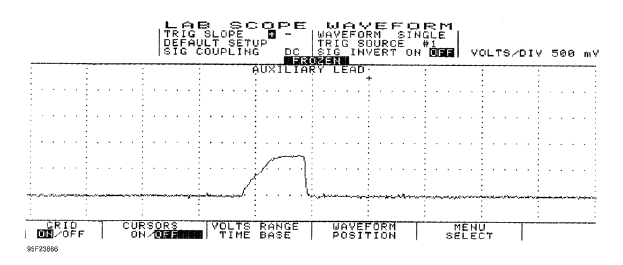
Fig. 6: Single Injector w/Normal Current Flow - Current Pattern
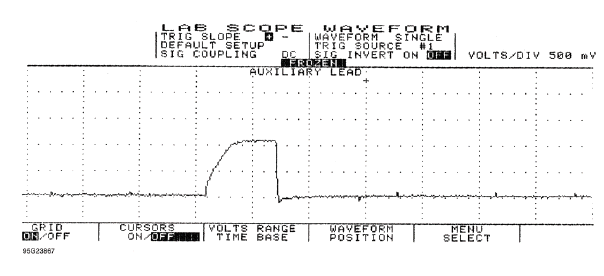
Fig. 7: Single Injector w/Excessive Current Flow - Current Pattern
EXAMPLE #2 - VOLTAGE CONTROLLED DRIVER
This time we will look at a GM 3.1L V6 VIN [T]. Fig. 8 shows the 1, 3, 5 (odd) injector bank with the current waveform indicating about a 2.6 amp draw at idle. This pattern, taken from a known good vehicle, correctly stays at or below the maximum 2.6 amps current range. Ideally, the current for each bank should be very close in comparison.
Notice the small dimple on the current flow's rising edge. This is the actual injector opening or what engineers refer to as the "set point." For good idle quality, the set point should be uniform between the banks.
When discussing Ohm's Law as it pertains to this parallel circuit, consider that each injector has specified resistance of 12.2 ohms. Since all three injectors are in parallel the total resistance of this parallel circuit drops to 4.1 ohms. Fourteen volts divided by four ohms would pull a maximum of 3.4 amps on this bank of injectors.
However, as we discussed in EXAMPLE #1 above, other factors knock this value down to roughly the 2.6 amp neighborhood.
Now we are going to take a look at the even bank of injectors; injectors 2, 4, and 6. See Fig. 9. Notice this bank peaked at 1.7 amps at idle as compared to the 2.6 amps peak of the odd bank (Fig. 8). Current flow between even and odd injectors banks is not uniform, yet it is not causing a driveability problem. That is because it is still under the maximum amperage we figured out earlier. But be aware this vehicle could develop a problem if the amperage flow increases any more.
Checking the resistance of this even injector group with a DVOM yielded 6.2 ohms, while the odd injector group in the previous example read 4.1 ohms.
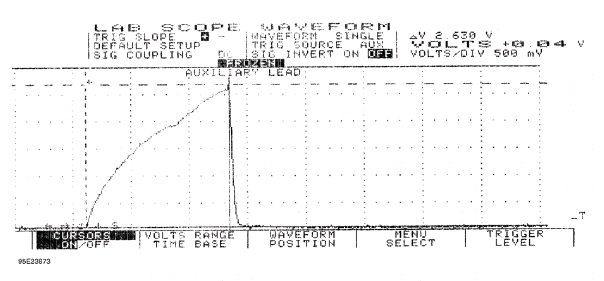
Fig. 8: Injector Odd Bank w/Normal Current Flow - Current Pattern
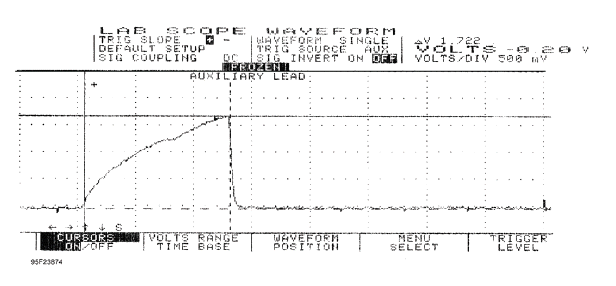
Fig. 9: Injector Even Bank w/Normal Current Flow - Current Pattern
EXAMPLE #3 - VOLTAGE CONTROLLED DRIVER
Example #3 is of a Ford 5.0L V8 SEFI. Fig. 10 shows a waveform of an individual injector at idle with the Lab Scope set on 200 milliamps per division. Notice the dimple in the rising edge. This dimple indicates the actual opening of the injector (set point) occurred at 400 milliamps and current peaked at 750 milliamps. This is a good specification for this engine.
The next waveform pattern in Fig. 11 shows an abnormality with another injector. With the Lab Scope set on 500 milliamps per division, you can see that the current waveform indicates a 1200 milliamp draw. This is a faulty injector.
Abnormally low resistance injectors create excessive current draw, causing rough idle, and possible computer driver damage.
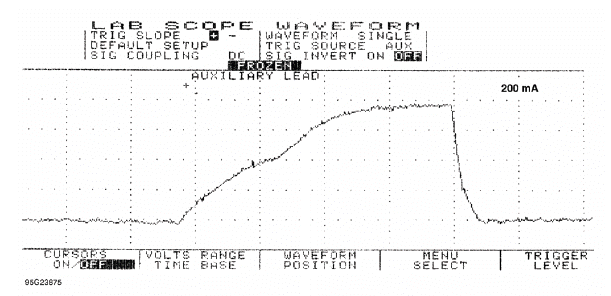
Fig. 10: Single Injector w/Normal Current Flow - Current Pattern
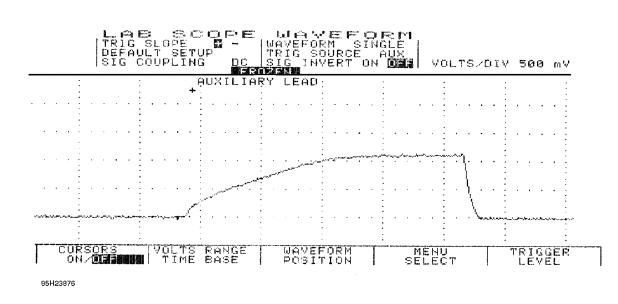
Fig. 11: Single Injector w/Excessive Current Flow - Current Pattern
EXAMPLE #4 - CURRENT CONTROLLED DRIVER
Example #4 is of a Ford 4.6L SEFI VIN [W]. See Fig. 12 for the known-good waveform pattern. This Ford system is different from the one above in EXAMPLE #3 as it peaks at 900 milliamps and the actual opening of the injector (set point) is just below 600 milliamps.
This is offered as a comparison against the Ford pattern listed above, as they are both Ford SEFI injectors but with different operating ranges. The point is that you should not make any broad assumptions for any manufacturer.
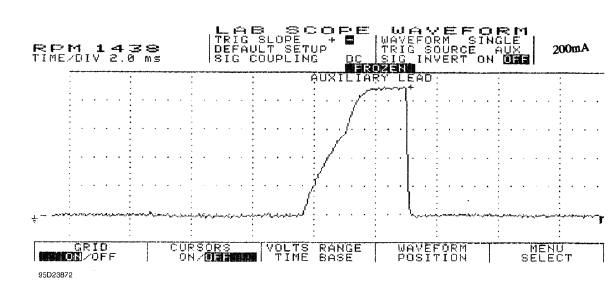
Fig. 12: Single Injector w/Normal Current Flow - Current Pattern
EXAMPLE #5 - CURRENT CONTROLLED DRIVER
The known-good waveform in Fig. 13 is from a Chrysler 3.0L V6 PFI VIN [3]. It is a perfect example of the peak and hold theory. The waveform shows a 1-amp per division current flow, ramping to 4 amps and then decreasing to 1-amp to hold the injector open.
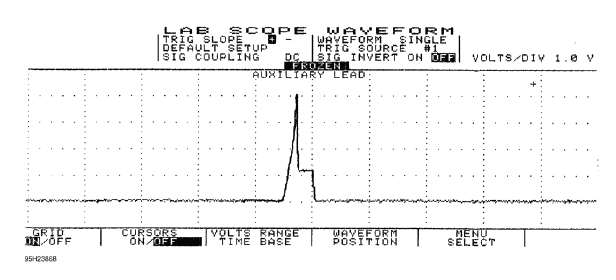
Fig. 13: Injector Bank w/Normal Current Flow - Current Pattern
EXAMPLE #6 - CURRENT CONTROLLED DRIVER
This next known-good waveform is from a Ford 5.0L V8 CFI VIN [F]. See Fig. 14. The pattern, which is set on a 250 milliamps scale, indicates a 1.25 amp peak draw and a hold at 350 milliamps.
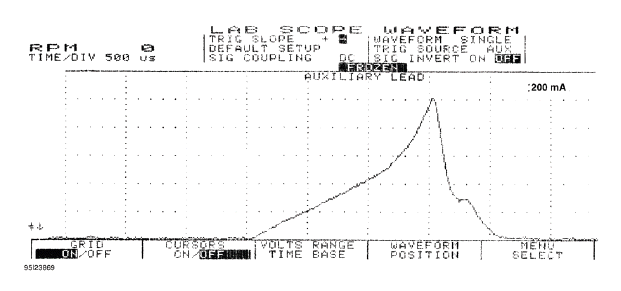
Fig. 14: Single Injector w/Normal Current Flow - Current Pattern
EXAMPLE #7 - CURRENT CONTROLLED DRIVER
The known-good current controlled type waveform in Fig. 15 is from a GM 2.0L TBI VIN [1]. With the lab scope set at 2 amps per division, notice that this system peaks at 4 amps and holds at 1 amp.
The next waveform is from the same type of engine, except that it shows a faulty injector. See Fig. 16. Notice that the current went to almost 5 amps and stayed at 1 amp during the hold pattern. Excessive amounts of current flow from bad injectors are a common source of intermittent computer shutdown. Using a current waveform pattern is the most accurate method of pinpointing this problem.
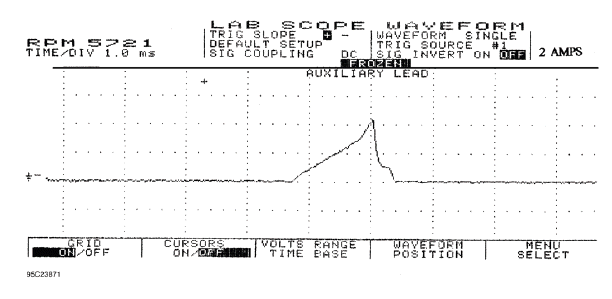
Fig. 15: Single Injector w/Normal Current Flow - Current Pattern
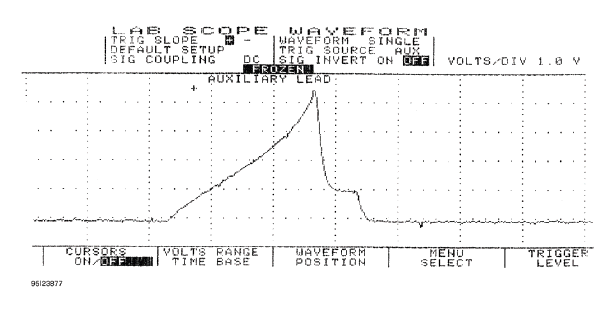
Fig. 16: Single Injector w/Excessive Current Flow - Current Pattern
EXAMPLE #8 - CURRENT CONTROLLED DRIVER
This known-good CPI system waveform from a GM 4.3L V6 CPI VIN [W] peaks at 4 amps and holds at 1-amp.
See Fig. 17 for waveform.
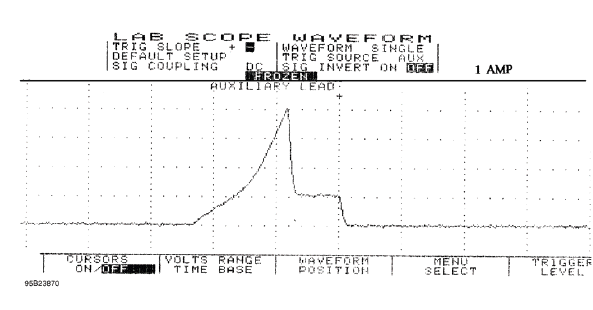
Fig. 17: Single Injector w/Normal Current Flow - Current Pattern
READ NEXT:
 Voltage Waveform Samples
NOTE: This is GENERAL information. This article is not intended to be
specific to any
unique situation or individual vehicle configuration. For model-specific
information see appropriate articles whe
Wheel Alignment Theory & Operation
* PLEASE READ THIS FIRST *
NOTE: This is GENERAL information. This article is not intended to be
specific to any
unique situation or individual vehicle configuration. For model-specific
information s
Maintenance
MAINTENANCE MAIN ITEMS (KA/KC MODELS)
If the message "SERVICE" does not appear more than 12 months after the
display is reset, change the
engine oil every year.
NOTE:
Independent of the maintenance
SEE MORE:
How To Information
HOW TO TROUBLESHOOT THE FUEL AND EMISSIONS SYSTEMS
Intermittent Failures
The term intermittent failure means a system may have had a failure, but it
checks OK now. If the malfunction
indicator lamp (MIL) on the dash does not come on, check for poor connections or
loose terminals at all
connectors
Audio/Information Screen
Displays the audio status and wallpaper. From this screen, you can go to
various
setup options.
Use simple gestures - including touching,
swiping, and scrolling - to operate certain audio
functions.
Wearing gloves may limit or prevent touchscreen
response.
You can use the microfiber soft cle
